Squares and Square Roots
1. If a number is multiplied by itself, the product that we get is called the square of the number.
For example:
4 x 4 = 42 = 16 (16 is square of 4)
20 x 20 = 202 = 400 (400 is square of 20)
2. Square of a number is represented as the number raised to the power 2.
3. A perfect square is a number that can be expressed as the product of two equal integers.
For example: 1, 4, 9, 16, 25, …, are all perfect square numbers.
4. Properties of square numbers:
(i) No square number ends with the digits 2, 3, 7 or 8 at its unit places.
(ii) The square numbers must end with the digits 0, 1, 4, 5, 6, 9 but the number ending with 0, 1, 4, 5, 6, 9 may or may not be a perfect number.
For example: 36 is a perfect square but 56 is not.
256 is a perfect square but 346 is not.
(iii) Square of even number is always an even and the square of odd number is odd.
For example:
42 = 16(even)
52 = 25(odd)
(iv) A perfect square can never be a negative number.
(v) For every natural number n, (n + 1)2 – n2 – (n + 1) + n
For example: 142 -132 = (13 + 1) + 13 = 14 + 13 = 27
262 – 252 = (25 + 1) + 25 = 26 + 25 = 51
5. Pythagorean Tripletr: A triplet (m, n,p) is called a Pythagorean triplet if m2 + n2 = p2
For example: (3, 4, 5), (8, 15, 17) and (20, 21, 29)
Product of two consecutive even or odd natural numbers:
Example:
11 x 13 = 143 – 122 – 1 (product of odds)
13 x 15 = 195 = 142 – 1 (product of odds)
44 x 46 = 2024 = 452 – 1 (product of evens)
Some Patterns in square numbers: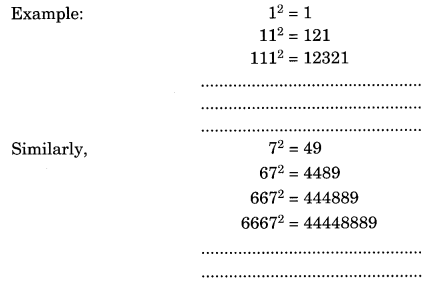
Comments